Protecting Real-Time Traffic: Wi-Fi 7 QoS Scheduling Tested Under Heavy Load
Wireless Testing
 Nimmy Varghese
July 24, 2026
Nimmy Varghese
July 24, 2026



 Nimmy Varghese
July 24, 2026
Nimmy Varghese
July 24, 2026
Wi-Fi 7 is built to handle far more demanding network conditions than previous generations, but establishing a fast, stable connection is only half the story. Once a device is connected and the network comes under real load, Wi-Fi 7 Quality of Service (QoS) determines whether that connection actually holds up. This article examines exactly that! How effectively do Wi-Fi 7 access points prioritize and protect real-time traffic when the wireless medium is under heavy contention?
Wi-Fi 7 introduces several enhancements aimed at improving traffic management and spectrum efficiency, including OFDMA-based scheduling and more intelligent resource allocation mechanisms. These capabilities are designed to ensure that latency-sensitive applications continue to receive the resources they need, even when the wireless medium is heavily utilized by competing traffic.
To evaluate how effectively Wi-Fi 7 access points handle these scenarios in practice, we created a controlled congestion environment consisting of simultaneous VoIP-style UDP traffic and high-throughput TCP traffic. The objective was to determine whether each access point could preserve real-time application performance while managing aggressive bandwidth demands from competing clients.
Quality of Service (QoS) in wireless networking refers to the set of mechanisms an access point uses to prioritize different types of traffic over a shared wireless medium. Not all traffic has the same tolerance for delay. A VoIP call drops in quality the moment latency exceeds a threshold. A video conference freezes when jitter spikes. A file download, by contrast, can tolerate seconds of additional delay without any perceptible impact on the user.
In legacy Wi-Fi, traffic prioritization was relatively straightforward because the connection model was simple. Wi-Fi 7’s introduction of OFDMA-based scheduling, Multi-Link Operation, and multi-band coordination significantly increases the complexity of the QoS challenge. The access point must now manage traffic prioritization not just across competing clients. That too across multiple simultaneous radio links and frequency bands. This makes the access point’s internal scheduler one of the most consequential components in a Wi-Fi 7 deployment.
Key Insight
The practical implication is that two access points can both claim Wi-Fi 7 certification while delivering vastly different Quality of Service outcomes under congestion. Standard throughput benchmarks do not reveal this gap. Only targeted testing under realistic mixed-traffic conditions can expose it.
In our earlier benchmark of Wi-Fi 7 MLO connection performance, we found that pre-association mechanics, not authentication speed, were the primary differentiator between vendors.
Standard Wi-Fi benchmarks measure throughput under ideal or lightly loaded conditions. These tests are useful for establishing peak capability. But they tell you very little about how Wi-Fi 7 Quality of Service (QoS) holds up in a real deployment where multiple clients are competing for airtime simultaneously. This is where bufferbloat becomes a critical variable.
Bufferbloat occurs when an access point’s internal memory buffers fill up faster than the hardware can transmit data onto the wireless medium. The result is that even high-priority packets, such as VoIP frames, end up queued behind large accumulations of bulk data. Average latency may appear stable, but worst-case tail latencies spike severely. This results in exactly the kind of disruption that real-time applications cannot tolerate.
Testing Wi-Fi 7 QoS scheduling under heavy synthetic load is one of the most effective ways to expose these failure modes. By simultaneously injecting latency-sensitive VoIP traffic and aggressive TCP saturation traffic, we can observe exactly how each vendor’s scheduler behaves when resources are genuinely constrained. This reveals the performance gaps that throughput tests leave hidden.
Understanding how EMLSR shapes multi-link connection behavior is equally relevant in context for this analysis.
All tests were conducted in a controlled RF chamber environment using the following hardware and software configuration:
| Component | Configuration |
|---|---|
| Access Points (AP) Under Test | Brand A, Brand B, Brand C |
| Stations (STA or Client) | Intel BE201 Wi-Fi 7 Windows – 2 Nos |
| Configuration of APs | WPA3 SAE with PMF enabled / 2.4 GHz and 5 GHz / OFDMA enabled / MLO disabled / Channel 1 (40 MHz) & Channel 36 (160 MHz) |
| Traffic Generation Tool | iPerf3.21 (CLI), Ping (CLI) |
| Environment | RF Chamber |
It is worth noting that MLO was deliberately disabled for this test. The objective was to isolate and evaluate the access point’s QoS scheduling and OFDMA performance on individual bands independently. This eliminated the additional variable of multi-link coordination. Each band was tested separately to produce clean, comparable results across 2.4 GHz and 5 GHz.
To investigate further, three Wi-Fi 7 AP platforms mentioned in the validation test environment were evaluated under simultaneous real-time and congestion traffic. Let’s dive deep into the device roles and traffic profiles!
The lab setup used for this analysis reflects the kind of controlled, purpose-built environment that modern wireless validation requires. For a broader look at what modern wireless test labs look like today and how they differ from legacy approaches, see our detailed breakdown of next-generation test lab infrastructure.
The test involved three device roles, each serving a distinct purpose in recreating a realistic congestion scenario:
STA1 was configured to emulate a VoIP-style real-time client, transmitting low-bitrate UDP packets at a fixed rate that mimics the packet cadence of a live voice call. STA2 acted as the congestion source, injecting sustained high-throughput TCP streams across multiple parallel connections to saturate available airtime. The server collected and logged all traffic for post-test analysis.
Each access point underwent the following test sequence:
The evaluation focused on three performance indicators that together define the real-world QoS experience for latency-sensitive applications:
The ability to keep round-trip times low and consistent under sustained congestion.
Minimizing variation in packet delivery timing, which directly impacts VoIP call quality.
Preventing extreme delay spikes during peak congestion, which can cause application-level disruption even when average metrics appear healthy.
Wi-Fi 7 also introduces significant advances in how spectrum is allocated across clients. See how OFDMA and Multi-RU allocation in Wi-Fi 7 perform in real over-the-air conditions.
Before examining the detailed findings, the high-level picture is worth stating clearly: all three Wi-Fi 7 access points successfully maintained VoIP traffic delivery throughout the test.
However, the manner in which each platform achieved these reveals significant differences in scheduling quality.
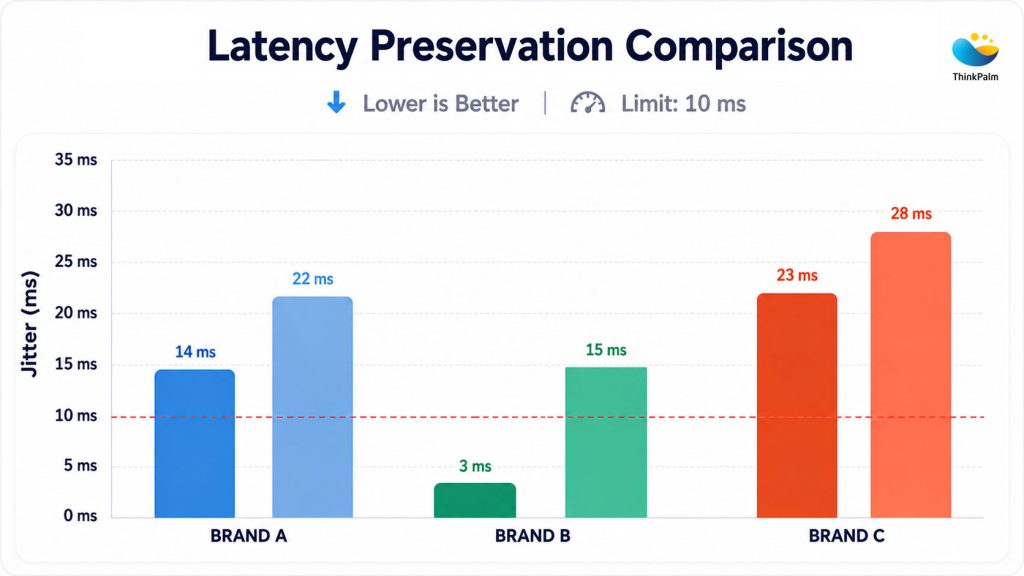
Latency Preservation Comparison: Lower RTT indicates better responsiveness.
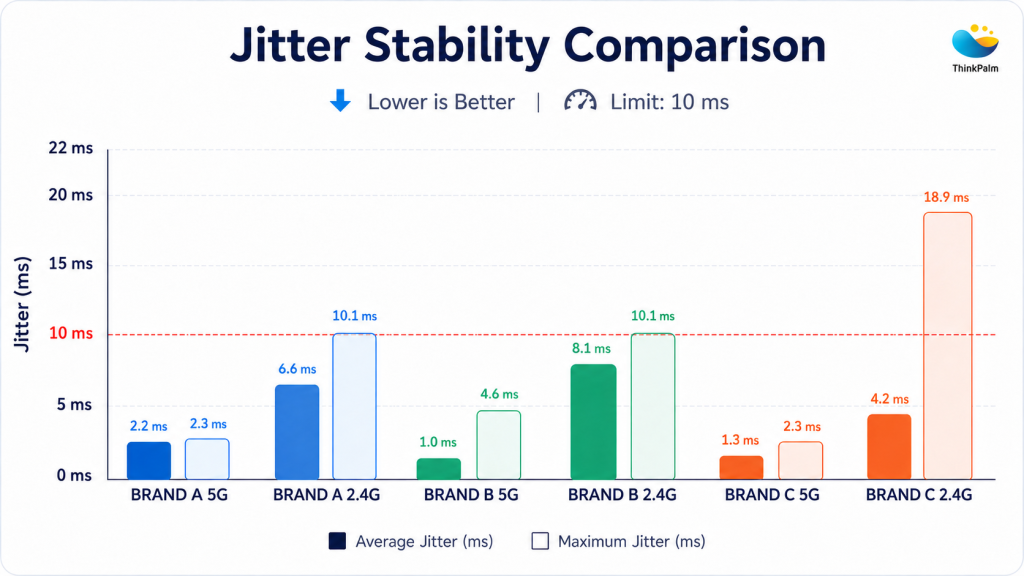
Jitter Stability Comparison: Lower jitter ensures smoother communication.
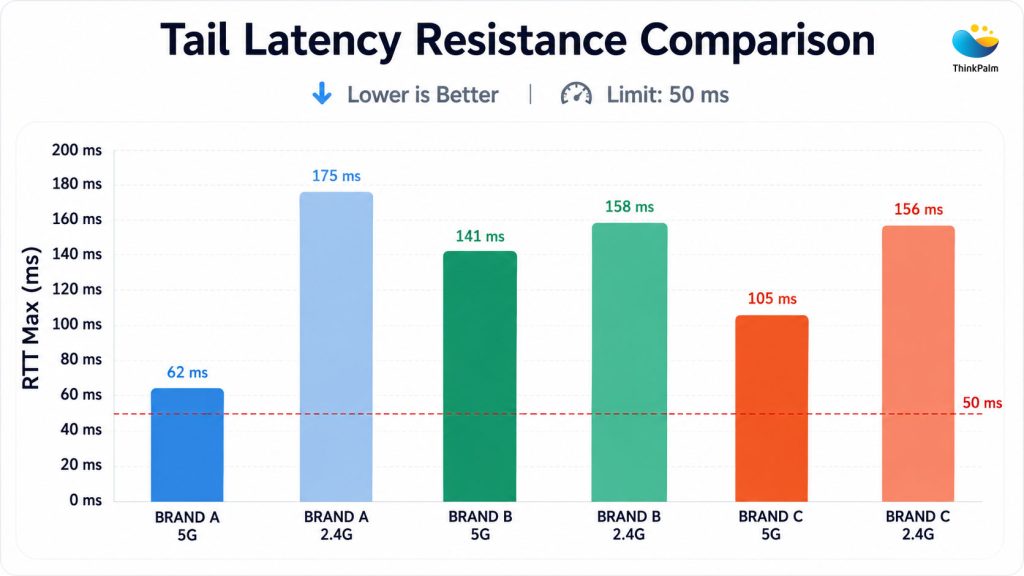
Tail Latency Resistance Comparison: Lower tail latency reflects greater network stability under load.
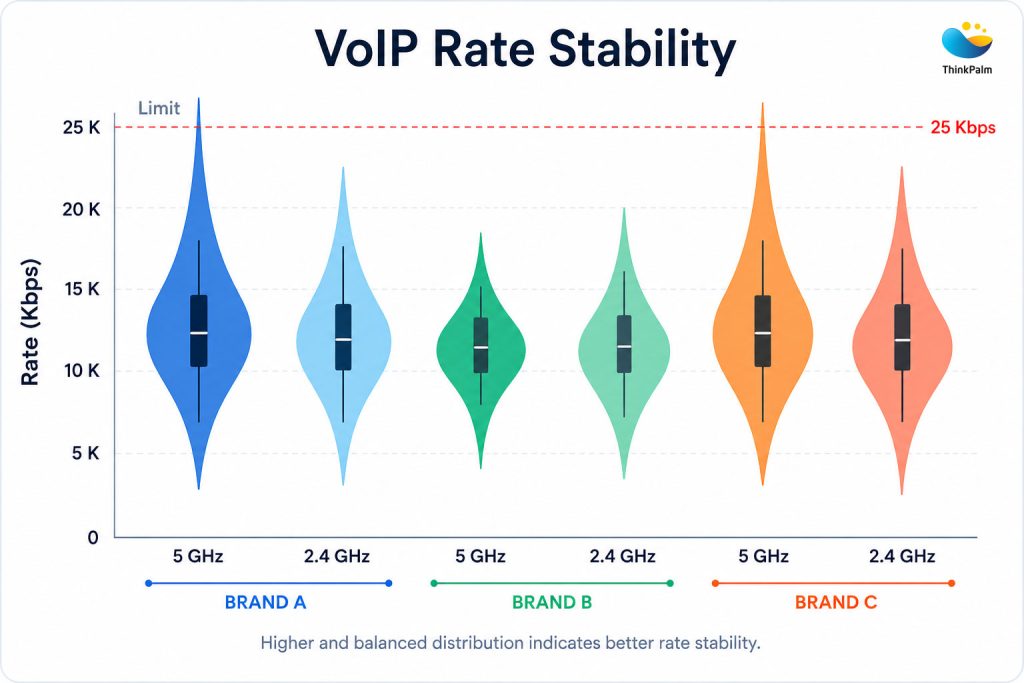
Wi-Fi 7 AP Vendor Comparison: VoIP Throughput Consistency
The comparative performance matrix below summarizes how each Wi-Fi 7 AP performed across the three most important quality indicators for real-time traffic under congestion:
It provides a side-by-side view of each platform’s behavior on both 2.4 GHz and 5 GHz bands, making it easier to identify which device maintained the most consistent VoIP experience under heavy TCP load.
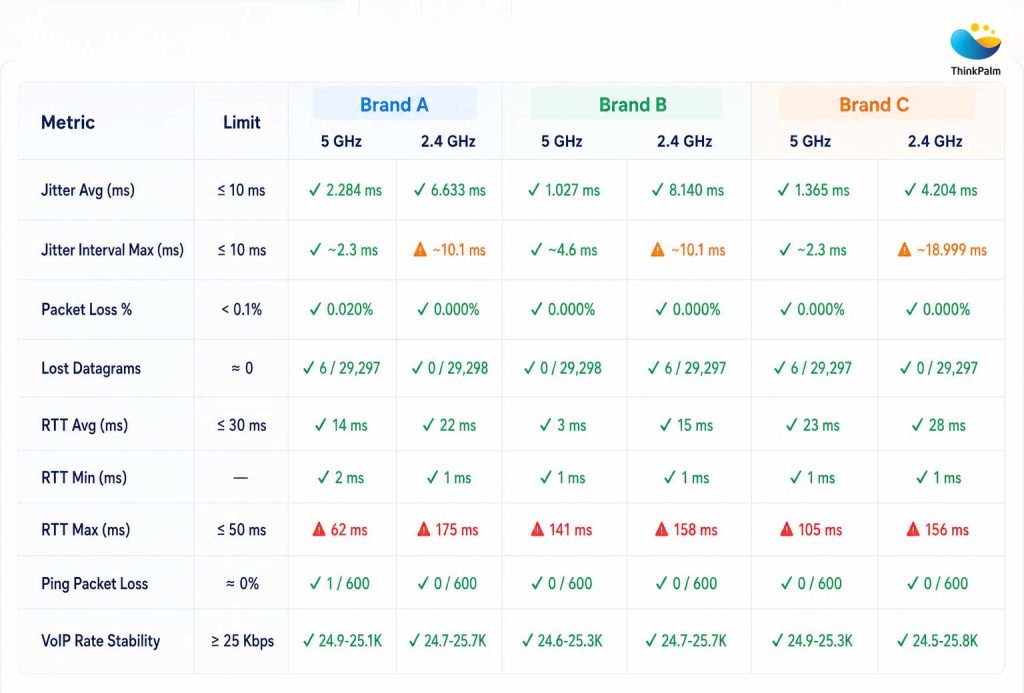
Comparative Performance Matrix Table
The jitter results reveal a significant and consistent performance divide between the 5 GHz and 2.4 GHz bands across all three vendors.
Under high traffic conditions, the 5 GHz radio across all three vendors managed to keep average jitter tightly bounded well below the strict 10 ms threshold. Brand B delivered an exceptional 1.027 ms average jitter on 5 GHz, indicating a highly optimized OFDMA-based scheduler that effectively prevents queue starvation for high-priority Voice and Video Access Categories (AC_VO and AC_VI).
When the heavy traffic load shifted to the narrower, more congested 2.4 GHz spectrum, the scheduling algorithms broke down across all three vendors. Brand A and Brand B experienced immediate degradation, with maximum jitter intervals crossing into warning territory at approximately 10.1 ms.
Brand C suffered the most severe degradation on the 2.4 GHz band, allowing a maximum jitter spike of 18.999 ms. This may indicate limitations in Brand C’s Enhanced Distributed Channel Access (EDCA) tuning or queue management behavior, where large background data bursts appear to delay time-sensitive real-time frames during transmission opportunities (TXOP).
The most significant architectural finding from this test is that every vendor breached the maximum Round-Trip Time (RTT) limit of 50 ms. This occurred across both radio bands.
This does not necessarily indicate a failure of the Wi-Fi 7 Quality of Service (QoS) standard itself. Instead, it points to vendor-specific buffer management limitations under congestion conditions the scheduler may not be fully tuned to handle.
Despite average RTT remaining well within the safe 30 ms boundary across all vendors, worst-case scheduling delays ballooned severely under heavy synthetic load.
Brand A hit a peak latency spike of 175 ms on its 2.4 GHz radio and 62 ms on 5 GHz. Brand B, despite recording an impressive 3 ms average RTT on 5 GHz, still allowed a maximum peak latency spike of 141 ms on the same band.
These spikes are classic indicators of bufferbloat. When the access point is bombarded with concurrent heavy traffic, memory buffers fill up faster than the hardware can serialize and transmit data onto the wireless medium. As a result, even high-priority packets end up sitting in deep memory queues, introducing severe delay bursts that disrupt real-time interactive applications, cloud gaming, and live telemetry streams.
When assessing packet loss (where the target threshold is below 0.1%), Brand A was the only platform unable to preserve complete stream integrity on the 5 GHz band. It registered a 0.020% packet loss, dropping 6 out of 29,297 datagrams, and logged a dropped packet during basic ping testing under load.
Brands B and C both proved highly robust in this regard, achieving zero packet loss across both 2.4 GHz and 5 GHz profiles. This confirms that their layer-2 transmission pipelines held up under sustained congestion.
Key Finding
Notably, all three vendors managed to keep VoIP rate stability tightly bounded within the 24.5 Kbps to 25.8 Kbps range, successfully satisfying the 25 Kbps benchmark. This confirms that the access point’s layer-2 traffic shaping can maintain steady throughput boundaries even when the underlying latency and jitter guarantees degrade. The Wi-Fi 7 access point QoS performance comparison here draws a clear line between layer-2 rate shaping, which all three vendors handle adequately, and true end-to-end latency protection, which separates the stronger platforms from the weaker ones.
ThinkPalm runs 802.11be pre-compliance testing in dedicated lab infrastructure, so results reflect real-world performance, not spec sheets.
Verdict: Brand B emerged as the strongest performer for real-time traffic handling in this test, pairing the lowest average jitter with an outstanding average RTT on the 5 GHz radio while maintaining zero packet loss.
Reason: This hardware is ideal for mission-critical, low-latency enterprise environments such as corporate VoIP, medical telemetry, or wireless industrial automation. However, network administrators should enforce strict band-steering policies to keep real-time devices on the 5 GHz radio, preventing clients from falling back to its weaker 2.4 GHz scheduling lane.
Verdict: Brand C delivered perfect packet delivery and stable throughput in this test, but its scheduling behavior showed weaker protection for latency-sensitive traffic during severe 2.4 GHz contention.
Reason: Brand C is highly reliable for standard home use, heavy content streaming, and smart-home IoT environments where dropping packets is unacceptable. For professional deployments, the WMM (Wi-Fi Multimedia) parameters should be manually tuned to give real-time voice and video streams stricter priority over bulk data.
Verdict: Brand A displayed the weakest defenses against heavy congestion. It was the only AP to drop high-priority UDP datagrams on the 5 GHz band and allowed worst-case RTT spikes to reach disruptive levels on the 2.4 GHz band.
Reason: Brand A should be deployed cautiously as a standalone access point in high-density or high-concurrency environments where real-time traffic cannot tolerate drops or sudden latency jumps. If deployed, it should be paired with an upstream solution utilizing Active Queue Management (AQM) algorithms to mitigate bufferbloat before traffic reaches the AP.
The empirical evaluation of Wi-Fi 7 Quality of Service (QoS) scheduling across these three platforms under heavy synthetic load highlights a critical engineering reality. While average performance numbers look stable, worst-case tail latencies and band-specific scheduling efficiency vary significantly across vendors. The data confirms that protecting real-time traffic relies far less on basic packet prioritization. It relies far more on how robustly a vendor’s firmware handles RF concurrency, EDCA implementation, and buffer queue management.
For network architects, IT procurement teams, and wireless engineers, this is an important finding. Choosing a Wi-Fi 7 access point based on throughput benchmarks alone will not reveal how it behaves when VoIP, video, and bulk data compete simultaneously for the same airtime. Studies like this are part of how ThinkPalm continues to bridge the gap between wireless standards and real-world network deployments.
QoS failures under load are easy to miss in the lab and costly to discover in the field. Let’s catch them first.
Nimmy Varghese is a Wi-Fi Test Engineer focused on Wi-Fi standards validation and certification testing. Her work involves validating wireless features, interoperability, protocol compliance, end-to-end connectivity, and optimizing test workflows for next-generation Wi-Fi devices.