Performance Testing, as you might be well aware, is one of the prominent and critical testing methods practiced in the software industry. Poorly performing applications can harm a company’s reputation by failing to meet the expected sales goals. Performance Testing is thus conducted to provide customers with information about their applications, based on speed, stability and scalability.
Apache JMeter is a Java desktop application used for performance testing and evaluation of the overall system performance under different loads. JMeter simulates users to send requests to server, and gets information from the server through different graphical reports.
Components You Should Know!
Test plan is a feature in JMeter tool that describes the chain of steps JMeter must execute when tests are run. A test plan consists of Thread Group, Timers, Configuration Elements, Listener, Assertion and more.
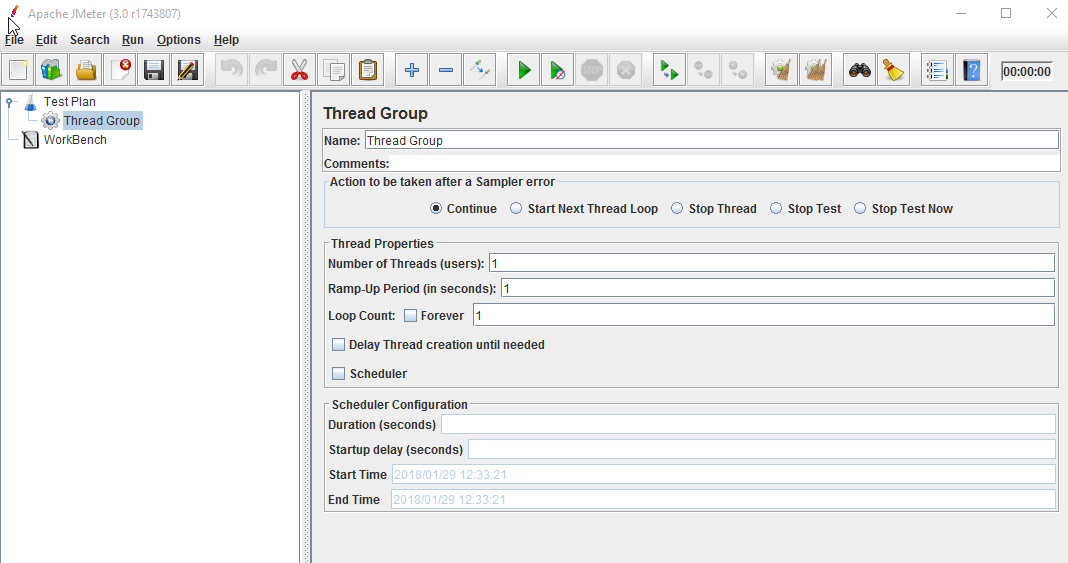
Thread group elements are the main components of our test plan. A thread group is a collection of users. Each thread represents one user using the application under test. We can manage the following elements by using thread groups:

Sampler is used for sending a specific type of request to the server. They are processed in their order of appearance in the tree. JMeter has a different type of sampler. HTTP Request Sampler is the sampler used for web application testing.
Logic controller controls the order in which samplers are processed. It provides a procedure for managing the flow of the thread group. If a request is coming from the child elements of a sampler, then by using logic controllers, we can change the order of requests.
Listener allows us to view the results of the sampler request and response in the form of tables, graphs, trees and more. These test results can be viewed, read and saved. It is possible to add Listener anywhere in the test plan.
Configuration Element enables us to declare variables. A configuration element is accessible from only inside the tree branch, where you place the element. A configuration element present in a tree node will have higher priority than the same element present in a parent node.
For example, if we are required to test a website for 100 users signing-in with different credentials, the script need not be run 100 times. We can parameterize the script to enter different login credentials. This login information (e.g. username, password) will be stored in a text file. JMeter has an element that allows us to read parameters from that text file. It is “CSV Data Set Config”, which is used to read lines from a file, and divides into variables.
Step 1: Add Thread Group
Step 2: Adding JMeter elements
Once the Test Plan is created, we should determine the elements to be added and removed from JMeter Test Plan.
Step 3: Adding Graph result
JMeter can show the test result in Graph format.
To add listener, right click on Test Plan, Add -> Listener -> Graph Results
Test Run on JMeter
Press Run button (Ctrl + R) on Toolbar to start the testing process.
The test results will be displayed as a graph in real time.
Analysing the results
We can analyse the performance of the software based on two parameters:
Throughput is the most important parameter. It represents the ability of the server to handle the load. Higher throughput indicates better performance.